Social distancing during the COVID-19 pandemic
Published:
This is your friendly neighborhood scientist asking you to practice social distancing if you have the privilege to do so!
 |
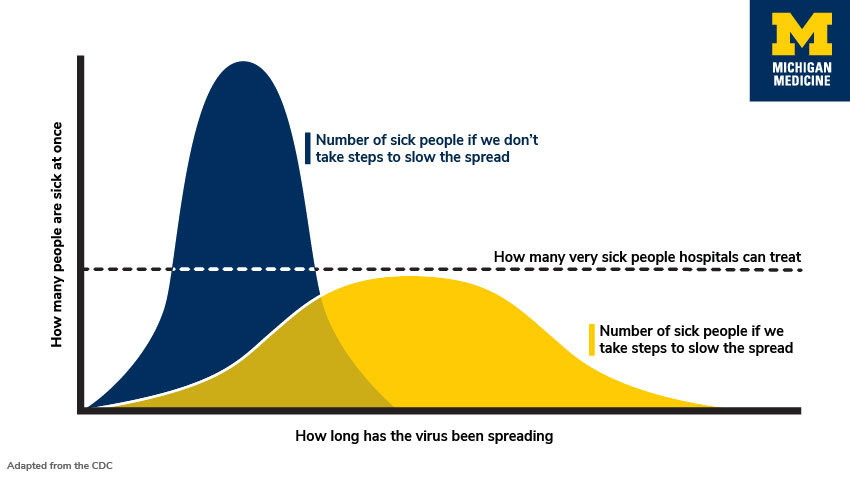
It may feel like the world is in chaos. By my assessment, there is no need to panic. However, there is a need to take the COVID-19 outbreak very seriously. Epidemiologists and other health officials are currently advocating for important public health measures which are not a political ploy or a dramatic overreaction. Based on history, peer-reviewed research, and the trajectories of current outbreaks worldwide, we know it is very important that we ‘flatten the curve’ of COVID-19 cases in the United States. This means we slow the virus’ spread now so we won’t overburden a health care system with a finite number of ICU beds, ventilators, and health care professionals. You can read more here and here. You can find scientists’ advice about what social distancing might look like for you here. You can read the CDC’s Community Mitigation Strategies here.
For a variety of reasons, many in society will be unable to practice social distancing adequately in the weeks to come. For example, certain professions such as caregivers and retail workers will need to continue daily operations. If you have the ability to work from home and/or minimize interactions outside your immediate families, please do so now! For many of us this means missing social gatherings or important events which we have planned for, spent money on, or looked forward to for some time. But, this also means we won’t be taking up health care resources for the more vulnerable among us. It also means we can play a role in stopping the exponential spread of the virus. You can learn more about the exponential spread of the virus here. And here are some informative simulations to visualize the positive impact of social distancing.
Importantly, research is emerging that COVID-19 is being spread before carriers are symptomatic, meaning that it’s not enough to just stay home from activities if you aren’t feeling well. Read the scientific pre-print or a more accessible summary. Although, as always, staying home when sick, washing your hands properly, and not touching your face are important public health measures.
It needs to be reiterated that COVID-19 is not the seasonal flu. The summary of a report from the Chinese Center for Disease Control and Prevention found a 2.3% case fatality rate in COVID-19 cases through February 11, 2020. A scientific pre-print attempting to adjust for a variety of data collection biases found an overall case fatality rate of 1.6%. Here is a summary of that work and its limitations. While the estimates thus far are not perfect, the case fatality rate does seem to be higher than that of the seasonal flu which was 0.1% in the U.S. in 2018-2019. Populations with higher co-morbidities (e.g. obesity, smoking), an older population, or an overburdened health care system could see case fatality rates that are higher.
Finally, it is also important to combat misinformation. Before sharing on social media, check the credentials of authors, potential biases of the sources, and the date of the news/posts to ascertain credibility. Memes are not credible. As a point of reference, I believe statements made by U.S. health care officials such as Dr. Tony Fauci, Dr. Deborah Birx, or Dr. Francis Collins are likely to be trustworthy and measured. I cannot vouch for them all, but these Twitter accounts may also be good sources of scientific evidence. The work by Our World in Data is also very thorough and the authors are up front about the limitations to their data analysis.
I will be updating this with useful links in the days to come. Stay well and practice social distancing!
March 16, 2020 Update
First, here is a data-rich article suggesting that countries that act fast reduce the number of deaths by at least 10x, a real time COVID-19 tracker in US and Canada, and a model hospitals are using to predict the COVID-19 impact and prepare themselves.
Respected biostatisticians, including Dr. Xihong Lin, have been working to analyze 25,000+ lab-confirmed COVID-19 cases from Wuhan, China. Their findings are in a scientific pre-print, summarized with this Twitter thread, and this slidedeck.
In this study, scientists estimated R, the effective reproductive number of the virus. This is the measurement of transmission potential and represents the average number of secondary infections produced by a typical case in a population where some people are susceptible and some are not (e.g. immunity due to previous COVID-19 infection). When R>1 the number of new cases will increase and when R<1 the number of new cases will decrease. Scientists tracked R across time and noted when specific interventions were mandated by the Chinese government. In Wuhan from January 1-10, R was estimated to be 3.88. Afer traffic bans, social distancing, and home quarantine, R was brought down to 1.25 by January 23-February 1. But this was still not enough to cause a decrease in the number of new cases. After centralized quarantine measures began, R decreased to 0.32 in the period after February 2. This R value is finally less than 1 and indicates a decrease in new cases. Centralized quarantine means suspected cases, close contacts of suspected cases, and cases who tested positive are all quarantined in designated spots such as hotels. They continue to receive care, and severe cases can be transported to hospitals’ ICUs. Based on these findings I believe we need to be prepared for such containment strategies down the line and take immediate mitigation (e.g. social distancing) strategies seriously.
Statistical modelling estimates that 60% of infected cases are not ascertained (e.g. not found and contained via quarantine) partially due to being asymptomatic. For example, a study estimated that 17.9% of positive cases on the Princess Cruise ship were asymptomatic, and we are 95% sure the true percentage of asymptomatic cases is between 15.5% and 20.2%. To find these unascertained cases we need more way more COVID-19 testing in the U.S. It is even more imperative that we stay home as much as possible, even if we feel fine. When you do so, you are protecting vulnerable populations including the elderly, our hero health care workers, and others who don’t have the privilege to remain at home.
 |
Panels A and B of Figure 3 from Wang et al showing the attack rate or number of new cases per day per 1 million people. Notably, health care workers (on the left in purple) and ages 60-79 (on the high in purple) had the highest rates. In the period afer centralized quarantine on February 2 the attack rate dropped for all groups.
March 17, 2020 Update
Epidemiologists in the UK released a sobering report yesterday regarding the pandemic’s trajectories given non pharmaceutical interventions (e.g. quarantine instead of medicine) in the US and UK. Suppression strategies would reduce R to be < 1 (remember R is the virus’ reproductive number) to < 1, but these strategies would need to be maintained until a vaccine becomes available. Mitigation strategies would reduce R, but not to the desired value of <1, while population immunity builds due to individuals recovering from the virus. Doing nothing in the face of this epidemic could result in 2.2 million deaths in the US. To put this in perspective, the CDC estimates 2.8 million people died of normally occuring disease/accidents in 2017.
The authors make several important points in the Discussion (page 14), which I recommend you read for yourself.
- China’s efforts have brought R < 1 and interventions are currently being relaxed. It important to monitor China in the weeks to come to inform strategies in other countries.
- “Population-wide social distancing applied to the population as a whole would have the largest impact; and in combination with other interventions – notably home isolation of cases and school and university closure – has the potential to suppress transmission below the threshold of R=1 required to rapidly reduce case incidence.”
- “For suppression, early action is important, and interventions need to be in place well before healthcare capacity is overwhelmed.”
- Mitigation would overwhelm the surge capacity of of UK and US health care systems with predicted 250,000 deaths in GB, and 1.1-1.2 million in the US.
- “To avoid a rebound in transmission, these policies will need to be maintained until large stocks of vaccine are available to immunize the population – which could be 18 months or more.”
- “Epidemic suppression is the only viable strategy at the current time.”
- “It is not at all certain that suppression will succeed long term; no public health intervention with such disruptive effects on society has been previously attempted for such a long duration of time”
I would like to remind readers that this is one report based on current information and understanding. There is no need to panic, but the findings most likely represent an upper bound on the projected impact of the pandemic. New treatments, scientific understanding of the virus, or innovative solutions may change projections for the better.
 |
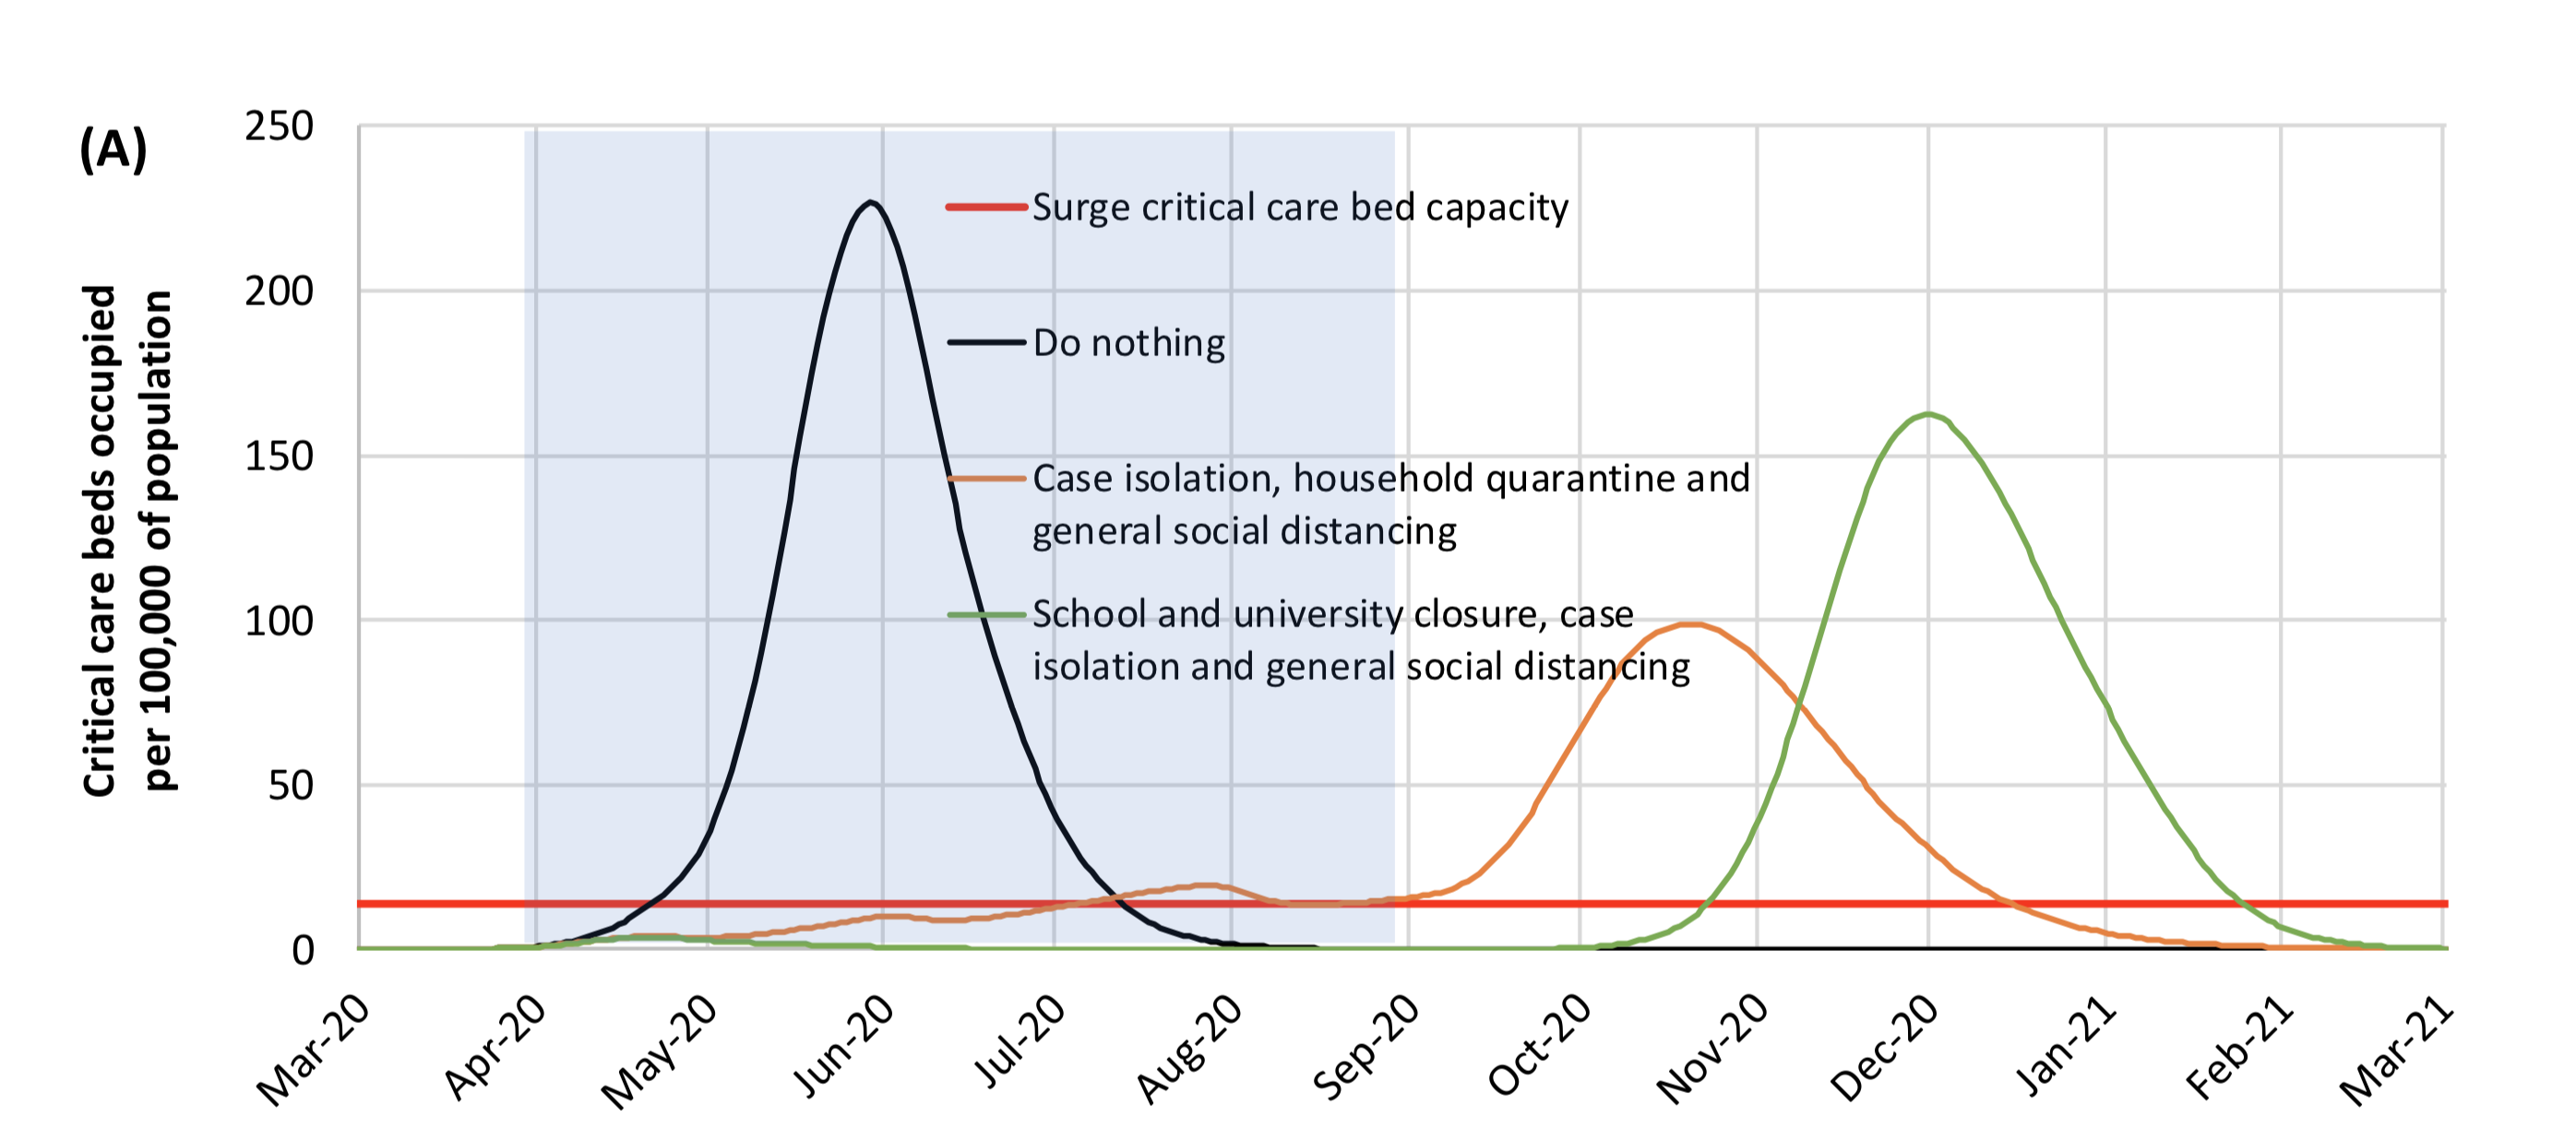
Appendix Figure A1 shows ICU bed occupancy in the U.S. under various suppression strategies. The blue shading is 5 months within which the suppression measures are in effect. As you see, the case load would increase when suppression strategies cease.
March 18, 2020 Update
A few brief updates.
An interview with NIH Director Dr. Francis Collins nicely explained the exponential curve of cases and the civic duty of social distancing.
More sobering projections regarding the length of time required to flatten the curve to minimize overburdening the health care system. Encouragingly, I’ve heard from a resident physician of changes being made in her own hospital to utilize telemedicine and outpatient services to prepare for an influx of patients. Therefore, the “beds for other patients” seen in the second figure is hopefully going to be a smaller number than models are currently accounting for.
A Nature Medicine publication clearly showed the SARS-CoV-2 (the name of the virus) which causes COVID-19 (the name of the novel penumonia trait associated with infection) is not a lab construct or a purposefully manipulated virus. This is important scientific evidence to fight misinformation, the blame game, and xenophobia.
A New England Journal of Medicine publication described the stability of the virus on surfaces and in the air. Based on observations, the virus is predicted to decay over time such that it reaches the limit of detection in 40 hours on copper, 20 hours on cardboard, 60 hours on stainless steel, and 80 hours on plastic. The amount of viable (e.g. infectious) virus on the surface decreases exponentially over time. The virus lasts in the air for at least three hours, but more work is needed to look at time scales past this short window. One potential limitaiton is the ability to perfectly mimic the conditions that would occur when a COVID-19 case coughs.
On a positive note, scientists around the world are looking for ways to help. I know there is an international group that is rapidly mobilizing existing resources to enable the study the genetics of infected patients in the hopes of identifying risk increasing or protective genetic alleles as well as genetic/risk factors correlated with worse outcomes.
A Call to Action, GIVE BLOOD! the American Red Cross is currently only shipping 75% of hospital’s orders due to a national blood shortage. I called yesterday to ask about their precautions and received the following message which NPR reported as well. *“The Red Cross says it has put new measures in place, including checking the temperature of staff and donors before they enter a drive location. Hand sanitizer is provided and used throughout the donation process. Beds are spaced in accordance with social distancing guidelines. And even more attention is given to disinfecting surfaces and equipment.**
